Optuna
Optuna is an automatic hyperparameter tuning framework. Some of the basic functionality of Optuna will be demonstrated in this page.
Demonstration
The following Kaggle notebook demonstrates the concepts explained in this page: 🎓 Optuna Demonstration
Introduction to Optuna
Importing Optuna
Optuna is not included in the Anaconda distrubution. You can install Optuna with the conda package manager by running the following command in Anaconda Prompt:
conda install -c conda-forge optuna
Installing Optuna
After installing Optuna, we can import the library into our Python session.
import optuna
To use Optuna to perform hyperparameter tuning for a specific model type, a study must be created. A study in Optuna refers to a single optimization problem. Each Optuna study consists of multiple trials. A trial in optuna is a single execution of a function that returns a value meanted to be minimized or maximized. In the context of hyperparameter tuning, a trail consists of selecting hyperparameter values for a model and then scoring the resulting model in some way, typically by using cross-validation.
An outline of the steps involved in creating a study is as follows:
Create an objective function representing a trail. a. Within the objective function, new hyperparameter values should be selected. b. A model object should be created using the new hyperparameter values. c. The model should be scored using cross-validation. d. The cross-validation score should be returned by the objective function.
Create a
studyobject, indiciate if the objective should be minimized or maximized.Pass the objective function to the
studyobject’soptimize()method, specifying the number of trials to perform. This will start the study.
The objective function should accept a single trial object as a parameter. Arguments for this parameter are supplied to the objective function when the optimize() function is called.
The hyperparameter values are generated by using suggest_float(), suggest_int(), and suggest_categorical() methods of the trial object. The use of these methods will be demonstrated below. The paramaters passed to these methods will define the parameter search space for the study. Optuna makes use of Bayesian optimization to strategically explore the search space for an optimal set of parameter values. It does this by employing an explore/exploit strategy in which new values are selected at random for each new trial, but values that have previously shown good performance will be selected more frequently.
Tuning a Logistic Regression Model
The cell below demonstrates the use of Optuna in performing hyperparameter tuning for a logistic regression classifier. The specific hyperparameters being tuned will be li_ratio and C. Notice that values for these hyperparameters are generated using the suggest_float() method of the trial object. We pass 4 arguments to suggest_float() in each call.
The 1st argument is a string that provides a name for the hyperparameter being tuned. This can be set to anything you like and is used only for reporting purposes.
The 2nd argument provides the lower bound for values to be considered for the hyperparameter.
The 3rd argument provides the upper bound for values to be considered for the hyperparameter.
The 4th argument set the
logparameter. If set toFalse, then values for the hyperparameter will be sampled according to a uniform distribution. If set toTrue, then values will be selected according to a uniform distribution on the log-space. The default value for'logisFalse.
def logreg_objective(trial):

    r = trial.suggest_float('l1_ratio', 0, 1, log=False)
    c = trial.suggest_float('C', 1e-10, 1000, log=True)

    clf =  LogisticRegression(max_iter=5000, solver='saga', penalty='elasticnet', l1_ratio=r, C=c)
    scores = cross_val_score(clf, X_train, y_train, cv=5, scoring='roc_auc')

    return scores.mean()

logreg_study = optuna.create_study(direction='maximize')
logreg_study.optimize(logreg_objective, n_trials=20)
[I 2021-11-20 12:02:29,595] A new study created in memory with name: no-name-5fd28f88-c24b-4f8e-8dcb-072a6a1cbc0b
[I 2021-11-20 12:02:29,616] Trial 0 finished with value: 0.5 and parameters: {'l1_ratio': 0.5439615394307834, 'C': 2.1771939082764177e-08}. Best is trial 0 with value: 0.5.
[I 2021-11-20 12:02:29,635] Trial 1 finished with value: 0.5 and parameters: {'l1_ratio': 0.488968701460022, 'C': 0.00017425521598500197}. Best is trial 0 with value: 0.5.
[I 2021-11-20 12:02:29,655] Trial 2 finished with value: 0.5 and parameters: {'l1_ratio': 0.19864784316264938, 'C': 6.789509511446001e-06}. Best is trial 0 with value: 0.5.
[I 2021-11-20 12:02:29,672] Trial 3 finished with value: 0.5 and parameters: {'l1_ratio': 0.3593833354400813, 'C': 1.678009740557353e-08}. Best is trial 0 with value: 0.5.
[I 2021-11-20 12:02:29,690] Trial 4 finished with value: 0.5 and parameters: {'l1_ratio': 0.5081372937816908, 'C': 2.430280354084403e-06}. Best is trial 0 with value: 0.5.
[I 2021-11-20 12:02:29,832] Trial 5 finished with value: 0.8761534073407342 and parameters: {'l1_ratio': 0.8627348371331411, 'C': 0.005179775796040812}. Best is trial 5 with value: 0.8761534073407342.
[I 2021-11-20 12:02:29,852] Trial 6 finished with value: 0.5 and parameters: {'l1_ratio': 0.3694908032800195, 'C': 6.16936130007863e-07}. Best is trial 5 with value: 0.8761534073407342.
[I 2021-11-20 12:02:30,921] Trial 7 finished with value: 0.9376967516751675 and parameters: {'l1_ratio': 0.7556557704020802, 'C': 1.0396990101137766}. Best is trial 7 with value: 0.9376967516751675.
[I 2021-11-20 12:02:30,942] Trial 8 finished with value: 0.5 and parameters: {'l1_ratio': 0.47815517761759985, 'C': 4.976095390745594e-05}. Best is trial 7 with value: 0.9376967516751675.
[I 2021-11-20 12:02:30,960] Trial 9 finished with value: 0.5 and parameters: {'l1_ratio': 0.7931672294743582, 'C': 1.4328945047053657e-05}. Best is trial 7 with value: 0.9376967516751675.
[I 2021-11-20 12:02:31,121] Trial 10 finished with value: 0.9374767256725672 and parameters: {'l1_ratio': 0.7342567830598226, 'C': 52.032662543117446}. Best is trial 7 with value: 0.9376967516751675.
[I 2021-11-20 12:02:31,277] Trial 11 finished with value: 0.9374767256725672 and parameters: {'l1_ratio': 0.7282738743236373, 'C': 114.85628214559995}. Best is trial 7 with value: 0.9376967516751675.
[I 2021-11-20 12:02:32,023] Trial 12 finished with value: 0.9375567296729674 and parameters: {'l1_ratio': 0.9965581503117389, 'C': 7.9523414174736935}. Best is trial 7 with value: 0.9376967516751675.
[I 2021-11-20 12:02:32,146] Trial 13 finished with value: 0.938216807680768 and parameters: {'l1_ratio': 0.9918136351747794, 'C': 0.15291280426403014}. Best is trial 13 with value: 0.938216807680768.
[I 2021-11-20 12:02:32,235] Trial 14 finished with value: 0.9363367776777677 and parameters: {'l1_ratio': 0.965496320102396, 'C': 0.039787714826508766}. Best is trial 13 with value: 0.938216807680768.
[I 2021-11-20 12:02:32,782] Trial 15 finished with value: 0.9378167476747674 and parameters: {'l1_ratio': 0.6789615206120907, 'C': 0.43150249665619084}. Best is trial 13 with value: 0.938216807680768.
[I 2021-11-20 12:02:32,914] Trial 16 finished with value: 0.9387368076807681 and parameters: {'l1_ratio': 0.015748667866465504, 'C': 0.04663515419102673}. Best is trial 16 with value: 0.9387368076807681.
[I 2021-11-20 12:02:33,038] Trial 17 finished with value: 0.9390968316831682 and parameters: {'l1_ratio': 0.023064201940723835, 'C': 0.023940006122544873}. Best is trial 17 with value: 0.9390968316831682.
[I 2021-11-20 12:02:33,063] Trial 18 finished with value: 0.5 and parameters: {'l1_ratio': 0.010855718933771253, 'C': 1.9278598847154537e-10}. Best is trial 17 with value: 0.9390968316831682.
[I 2021-11-20 12:02:33,150] Trial 19 finished with value: 0.9365167496749676 and parameters: {'l1_ratio': 0.0044156336538472545, 'C': 0.0030437943584289925}. Best is trial 17 with value: 0.9390968316831682.
Viewing Results
Each study object contains best_value and best_params attributes that record the score and hyperparameter values for the best trial found within the study.
print(logreg_study.best_value)
print(logreg_study.best_params)
0.946138397839784
{'l1_ratio': 0.20439010954745684, 'C': 0.05549100030357322}
Results DataFrame
A study object also has a trails_dataframe() method that returns a Pandas DataFrame with summary information about for all of the trials. This can be saved to a csv file to store the results of the study. It could be useful to identify and train multiple high-performing models from the study to use in an ensemble model.
logreg_df = logreg_study.trials_dataframe()
logreg_df.head()
| number | value | datetime_start | datetime_complete | duration | params_C | params_l1_ratio | state | |
|---|---|---|---|---|---|---|---|---|
| 0 | 0 | 0.864617 | 2021-11-20 11:33:26.250878 | 2021-11-20 11:33:26.286782 | 0 days 00:00:00.035904 | 0.002365 | 0.434270 | COMPLETE |
| 1 | 1 | 0.946138 | 2021-11-20 11:33:26.287780 | 2021-11-20 11:33:26.324680 | 0 days 00:00:00.036900 | 0.055491 | 0.204390 | COMPLETE |
| 2 | 2 | 0.929858 | 2021-11-20 11:33:26.325677 | 2021-11-20 11:33:26.347619 | 0 days 00:00:00.021942 | 0.002320 | 0.088279 | COMPLETE |
| 3 | 3 | 0.945438 | 2021-11-20 11:33:26.348615 | 2021-11-20 11:33:26.488242 | 0 days 00:00:00.139627 | 1.485138 | 0.237773 | COMPLETE |
| 4 | 4 | 0.944938 | 2021-11-20 11:33:26.489240 | 2021-11-20 11:33:26.524147 | 0 days 00:00:00.034907 | 0.027652 | 0.638375 | COMPLETE |
Tuning a Decision Tree Model
The cell below demonstrates the use of Optuna in performing hyperparameter tuning for a decision tree classifier. The specific hyperparameters being tuned will be max_depth and min_samples_leaf. These hyperparameter both expect integer values, which will be generated using the suggest_int() method of the trial object. The arguments passed to suggest_int() are similar to those for suggest_float(), but notice that we do not provide a value for the log parameter. This parameter is not used for suggest_int().
def dtree_objective(trial):

    md = trial.suggest_int('max_depth', 2, 64)
    mi = trial.suggest_int('min_inst', 1, 32)

    clf =  DecisionTreeClassifier(max_depth=md, min_samples_leaf=mi, random_state=1, )
    scores = cross_val_score(clf, X_train, y_train, cv=5, scoring='roc_auc')

    return scores.mean()

dtree_study = optuna.create_study(direction='maximize')
dtree_study.optimize(dtree_objective, n_trials=20)
[I 2021-11-20 12:02:21,194] A new study created in memory with name: no-name-632bcc8d-e771-436f-9d8a-be022958be71
[I 2021-11-20 12:02:21,243] Trial 0 finished with value: 0.8688124402440245 and parameters: {'max_depth': 6, 'min_inst': 22}. Best is trial 0 with value: 0.8688124402440245.
[I 2021-11-20 12:02:21,300] Trial 1 finished with value: 0.8614617341734174 and parameters: {'max_depth': 39, 'min_inst': 8}. Best is trial 0 with value: 0.8688124402440245.
[I 2021-11-20 12:02:21,360] Trial 2 finished with value: 0.8246203520352035 and parameters: {'max_depth': 58, 'min_inst': 4}. Best is trial 0 with value: 0.8688124402440245.
[I 2021-11-20 12:02:21,405] Trial 3 finished with value: 0.8477817161716171 and parameters: {'max_depth': 18, 'min_inst': 30}. Best is trial 0 with value: 0.8688124402440245.
[I 2021-11-20 12:02:21,456] Trial 4 finished with value: 0.8710627762776276 and parameters: {'max_depth': 21, 'min_inst': 18}. Best is trial 4 with value: 0.8710627762776276.
[I 2021-11-20 12:02:21,505] Trial 5 finished with value: 0.8736428712871286 and parameters: {'max_depth': 6, 'min_inst': 15}. Best is trial 5 with value: 0.8736428712871286.
[I 2021-11-20 12:02:21,550] Trial 6 finished with value: 0.8460919591959197 and parameters: {'max_depth': 14, 'min_inst': 31}. Best is trial 5 with value: 0.8736428712871286.
[I 2021-11-20 12:02:21,600] Trial 7 finished with value: 0.8683924272427241 and parameters: {'max_depth': 8, 'min_inst': 20}. Best is trial 5 with value: 0.8736428712871286.
[I 2021-11-20 12:02:21,664] Trial 8 finished with value: 0.8112794579457946 and parameters: {'max_depth': 13, 'min_inst': 2}. Best is trial 5 with value: 0.8736428712871286.
[I 2021-11-20 12:02:21,714] Trial 9 finished with value: 0.8710627762776276 and parameters: {'max_depth': 36, 'min_inst': 18}. Best is trial 5 with value: 0.8736428712871286.
[I 2021-11-20 12:02:21,774] Trial 10 finished with value: 0.8656518551855186 and parameters: {'max_depth': 52, 'min_inst': 11}. Best is trial 5 with value: 0.8736428712871286.
[I 2021-11-20 12:02:21,833] Trial 11 finished with value: 0.8715330193019302 and parameters: {'max_depth': 24, 'min_inst': 13}. Best is trial 5 with value: 0.8736428712871286.
[I 2021-11-20 12:02:21,893] Trial 12 finished with value: 0.8738530263026302 and parameters: {'max_depth': 25, 'min_inst': 12}. Best is trial 12 with value: 0.8738530263026302.
[I 2021-11-20 12:02:21,930] Trial 13 finished with value: 0.7904284678467848 and parameters: {'max_depth': 2, 'min_inst': 25}. Best is trial 12 with value: 0.8738530263026302.
[I 2021-11-20 12:02:21,989] Trial 14 finished with value: 0.8715330193019302 and parameters: {'max_depth': 29, 'min_inst': 13}. Best is trial 12 with value: 0.8738530263026302.
[I 2021-11-20 12:02:22,052] Trial 15 finished with value: 0.856791488148815 and parameters: {'max_depth': 45, 'min_inst': 7}. Best is trial 12 with value: 0.8738530263026302.
[I 2021-11-20 12:02:22,110] Trial 16 finished with value: 0.8778929582958297 and parameters: {'max_depth': 30, 'min_inst': 15}. Best is trial 16 with value: 0.8778929582958297.
[I 2021-11-20 12:02:22,171] Trial 17 finished with value: 0.863722182218222 and parameters: {'max_depth': 29, 'min_inst': 9}. Best is trial 16 with value: 0.8778929582958297.
[I 2021-11-20 12:02:22,224] Trial 18 finished with value: 0.8651120332033203 and parameters: {'max_depth': 45, 'min_inst': 25}. Best is trial 16 with value: 0.8778929582958297.
[I 2021-11-20 12:02:22,282] Trial 19 finished with value: 0.8778929582958297 and parameters: {'max_depth': 31, 'min_inst': 15}. Best is trial 16 with value: 0.8778929582958297.
Viewing Results
The cell below prints the best_value and best_params attributes for the decision tree study.
print(dtree_study.best_value)
print(dtree_study.best_params)
0.8778929582958297
{'max_depth': 30, 'min_inst': 15}
Results DataFrame
In the cell below, the head of the results DataFrame is displayed for the decision tree study.
dtree_df = dtree_study.trials_dataframe()
dtree_df.head()
| number | value | datetime_start | datetime_complete | duration | params_max_depth | params_min_inst | state | |
|---|---|---|---|---|---|---|---|---|
| 0 | 0 | 0.868812 | 2021-11-20 12:02:21.196195 | 2021-11-20 12:02:21.243069 | 0 days 00:00:00.046874 | 6 | 22 | COMPLETE |
| 1 | 1 | 0.861462 | 2021-11-20 12:02:21.244066 | 2021-11-20 12:02:21.300913 | 0 days 00:00:00.056847 | 39 | 8 | COMPLETE |
| 2 | 2 | 0.824620 | 2021-11-20 12:02:21.301911 | 2021-11-20 12:02:21.360754 | 0 days 00:00:00.058843 | 58 | 4 | COMPLETE |
| 3 | 3 | 0.847782 | 2021-11-20 12:02:21.361751 | 2021-11-20 12:02:21.405634 | 0 days 00:00:00.043883 | 18 | 30 | COMPLETE |
| 4 | 4 | 0.871063 | 2021-11-20 12:02:21.406631 | 2021-11-20 12:02:21.456498 | 0 days 00:00:00.049867 | 21 | 18 | COMPLETE |
Study Visualizations
Optuna provides several functions for creating plots useful for visualizing information relating to a study. Two of these functions, plot_optimization_history() and plot_slice(), will be demonstrated in this page. Please refer to Optuna Visualizations for information on these and other available visualizations.
The cell below imports the two visualization functions used in this page.
from optuna.visualization import plot_optimization_history, plot_slice
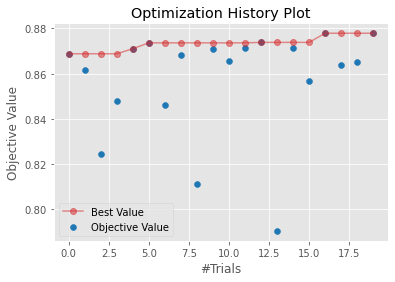
Plot Optimization History
The plot_optimization_history() function displays scatter plot showing the results of each trial of a study in order. The plot also includes a line plot showing the best score that has been obtained as the study progresses. This plot is useful for helping you to determine if the study was still making progress when it completed the specified number of trials.
plot_optimization_history(dtree_study)
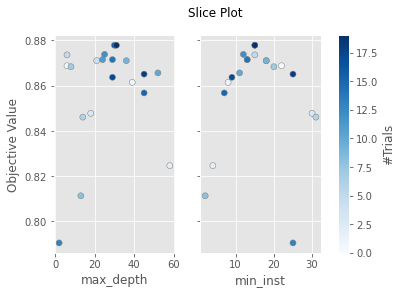
Plot Slice
The plot_slice() function displays a grid of scatter plots with one plot for each parameter being tuned. Each plot will contain one dot for each trial, with the dot indicating the score for the trial and relevant parameter value used in that trial. These plots can be used to graphically illustrate which values were performing well for each parameter, and can help you to determine if the search space for your study should be expanded or adjusted.
plot_slice(dtree_study)
Additional Resources
The following resources contain additional information about Optuna.